
Table of Contents
MySQL is one of the most popular database management systems used today. Its scalability, high performance, security, cross-platform support, and compatibility with a range of other programming languages make it a top choice across a range of database applications including content management systems, cloud integration, and e-commerce sites. Knowing how to work with MySQL at a deeper level is essentail to taking advantage of its full capabilities. This exercise will go over MySQL optimization best practices and will use a bike shop dataset to show the impact proper performance tuning can have.
Importance of Performance Tuning
Performance tuning plays a crucial role in efficient and effective database utilization. Execution times, resource consumption, and overall user experience can be greatly enhanced through proper use:
Faster Query Execution
- Efficient query execution can be the difference between waiting 0.0002 seconds and 20 minutes. As the database grows, these inefficiencies will further bog down the execution times.
Resource Efficiency
- Minimizing resources like CPU and Memory can reduce server strain and in some cases save money with lower infrastructure costs.
Better User Experience
- Application reliability, latency, and load times can be greatly reduced - creating a much smoother user experience.
System-Level Tuning
System-level tuning focuses on the hardware and operating system to enhance elements such as processing power, memory, and network configurations. The exact configurations depends heavily on the type of SQL processing being used (eg. whether or not the process is read-heavy or writing-heavy). The following should be considered for system-level tuning:
Hardware
- CPU - Higher processing speed and greater caching capabilities can lead to faster queries and performance.
- MyISAM vs. InnoDB
-
MyISAM InnoDB Pros - fast read operations
- Less disk space consuption
- Lower memory usage
- ACID (atomic, consistent, isolated, and durable) compliant
- Supports foreign keys
- Faster write-heavy applications
- Better crash recovery mechanisms
- Supports transactions
Cons - Less reliable
- Prone to corruption
- Not ACID compliant
- Does not support foreign keys
- Does not support transactions
- Requires more memory
- Requires more storage
Best For Simple read-heavy applications where data integrity is not important All other applications - SSDs and HDDs - SSDs are generally preferred due to greater data access speeds.
Operating System
- Input/Output (I/O) Scheduling - Used to configure the order and priority of disk read and write operations.
Network Configuration
- TCP Settings - Adjusting TCP buffer sizes can impact network-intensive MySQL environments with larger buffer sizes benefiting long-distance and high-latency networks. Adjusting TCP backlog settings can help with burst requests in MySQL by preventing connection drops and timeouts.
As the data and requirements grow, the hardware must be increased to keep up with the greater demand. Both vertical scaling (eg. higher CPU, more RAM, and faster or larger storage) and horizontal scaling (eg. server clustering and more distributed architecture) should be considered.
Software-Based Tuning
Increasing MySQL performance through software is done through configuring many of the MySQL settings which can greatly improve performance through efficiency and data processing speeds.
Query Optimization
- Indexing - Proper indexing calls for faster querying by creating pointers to where data is stored
- Do not over index
-
Create indexes where the
WHEREclause andJOINconditions are most frequently used - Use composite indexes where queries involve multiple indexes
-
Avoid using functions in
WHEREclause as it can prevent use of indexes - Joins - Efficiently join tables on primary and foreign keys
-
Use the appropriate join type depending on your data relationships (
INNER,LEFT,RIGHT,OUTER) - Cross joins can lead to a large number of rows being processed
Cache Configurations
- query caching often boosts performance in repetitive queries
-
Adjustment Variable Use Recommended Configuration query_cache_size Determines the amount of memory allocated to the query cache 0 disables the query cache (default), 1 allows caching all series, 2 enables caching only with the SQL_CACHEhintquery_cache_type Determines how query cache operates 10% to 20% of total memory is recommended to start InnoDB Storage Engine Configuration
-
Adjustment Variable Use Recommended Configuration Innodb_buffer_pool_size Adjusts server RAM for caching 50-70% of RAM Innodb_log_file_size Adjust size of redo log files Increase if more than 50% being utilized Innodb_flush_log_at_trx_commit Adjust how transaction logs are written and flushed to the disk Set to 1 for ACID compliance and durability; 0 or 2 for better performance at the cost of durability Innodb_flush_method Determines how data and logs are flushed to disk O_DIRECTfor SSDs andfsyncfor HDDInnodb_file_per_table Store each InnoDB table as its own file making scaling easier Enable with ONInnodb_stats_on_metadata Controls whether storage engine recalculates table statistics Disable with OFFInnodb_buffer_pool_instances Splits the buffer pool into multiple instances 1 instance per 1GB of buffer pool size with a limit of 8 Database Configuration
-
Defragmenting Tables: Use the
OPTIMIZE TABLEcommand to reduce storage space and improve I/O efficiency. - Archiving Data: Archiving old data that is no longer being used can
-
Repairing Corrupted Tables: Use
CHECK TABLEto see if the table is corrupted andREPAIR TABLEto repair the corrupted table.
Measuring Performance
Measuring performance is essential for knowing what steps to take in optimizing MySQL servers. Performance monitoring can be categorized into two main types - resource metrics (software, hardware, network resources consumed) and workload metrics (output a database can produce). Within these broader categories, there are a number of different ways to measure performance:
Monitoring Query Performance
-
EXPLAINis used to get information about a query execution and returns the following column items: -
Column Description Output values id Identifies the query step integer (eg. 1) select_type Identifies the type of query SIMPLE- a select without using unions or subqueriesPRIMARY- an outermost selectUNION- secondSELECTquery type in aUNIONDEPENDENT UNION- union dependent on outer queryUNION RESULT- the result of a unionSUBQUERY- a select query used in another select query (not usingFROMclause)DEPENDENT SUBQUERY- subquery dependent on outer queryDERIVED- a select query usingFROMclauseDEPENDENT DERIVED- derived table dependent on another tableMATERIALIZED- temporary subquery table generated in memoryUNCACHEABLE SUBQUERY- a subquery where the result cannot be cached and must be re-evaluated for each outer query rowUNCACHEABLE UNION- a union in anUNCACHEABLE SUBQUERY
table Table name being accessed string (eg. store_sales.orders) partitions Lists partitions being used (how the query is being split) partition identifier (eg. p1) type Identifies the join type ALL- fully scans tableindex- full index scanrange- scans a range of rows using indexseref- search rows with matching indexed valueseq_ref- joins using a unique keyconst- uses a constant row or system table
possible_keys Identifies indexes being considered for query Key type (eg. PRIMARY) key Returns the index being used in the listed step Key type (eg. PRIMARY) key_len Returns the length of the key being used integer (eg. 10) ref Returns the column constant used with the index Column name (eg. store_sales.order.order_id) rows Returns the number of rows being queried integer (eg. 2000) filtered Returns a percentage of rows being filtered integer (eg. 100) extra Returns additional information Using index- the query only uses indexes to get dataUsing where- retrieves all rows and then applies filterUsing temporary- creates a temporary tableUsing filesort- an external sort is made
Tracking Server Metrics
-
Return server metrics using
SHOW [GLOBAL|SESSION] STATUS; - Using
GLOBALreturns aggregated values across all connection - Using
SESSIONreturns current connection values -
SHOW [GLOBAL|SESSION] STATUS;returns a number of metrics including: -
Status Variable Category Status Variable Description Connections ConnectionsTotal number of connections Threads_connectedNumber of active connections Threads_runningNumber of threads actively running queries Aborted_connectsFailed connection attempts Queries QueriesTotal number of queries Slow_queriesNumber of queries exceeding configured query speed threshold Com_selectNumber of SELECToperationscom_insertReturns the length of the key being used Table and Row Operations Handler_read_rndNumber of random reads performed Handler_read_keyNumber of reads using indexes Handler_writeNumber of rows written Handler_deleteNumber of deleted rows Cache and Buffer Utilization Qcache_hitsNumber of query cache hits Qcache_insertsNumber of queries added to query cache Innodb_buffer_pool_read_requestsNumber of read requests to the InnoDB buffer pool * Note: not all variables are covered in this table. CLick HERE for a full list of server status variable explanations.
There are a multitude of ways to measure performance. SHOW [GLOBAL|SESSION] STATUS; alone will return over a hundred status variables. They key is to know which status variables are important for which metric you want to focus on and how to read its output. It's important to also note that there are several third party applications such as
ManageEngine,
DigitalOcean, and
Percona
which can help monitor your MYSQL performance - each with their own strengths and weaknesses depending on your use case.
Applying Performance Tuning Practices to Bike Shop Dataset
This section will apply some of the mentioned MySQL performance strategies using a bike shop dataset.
Query Optimization
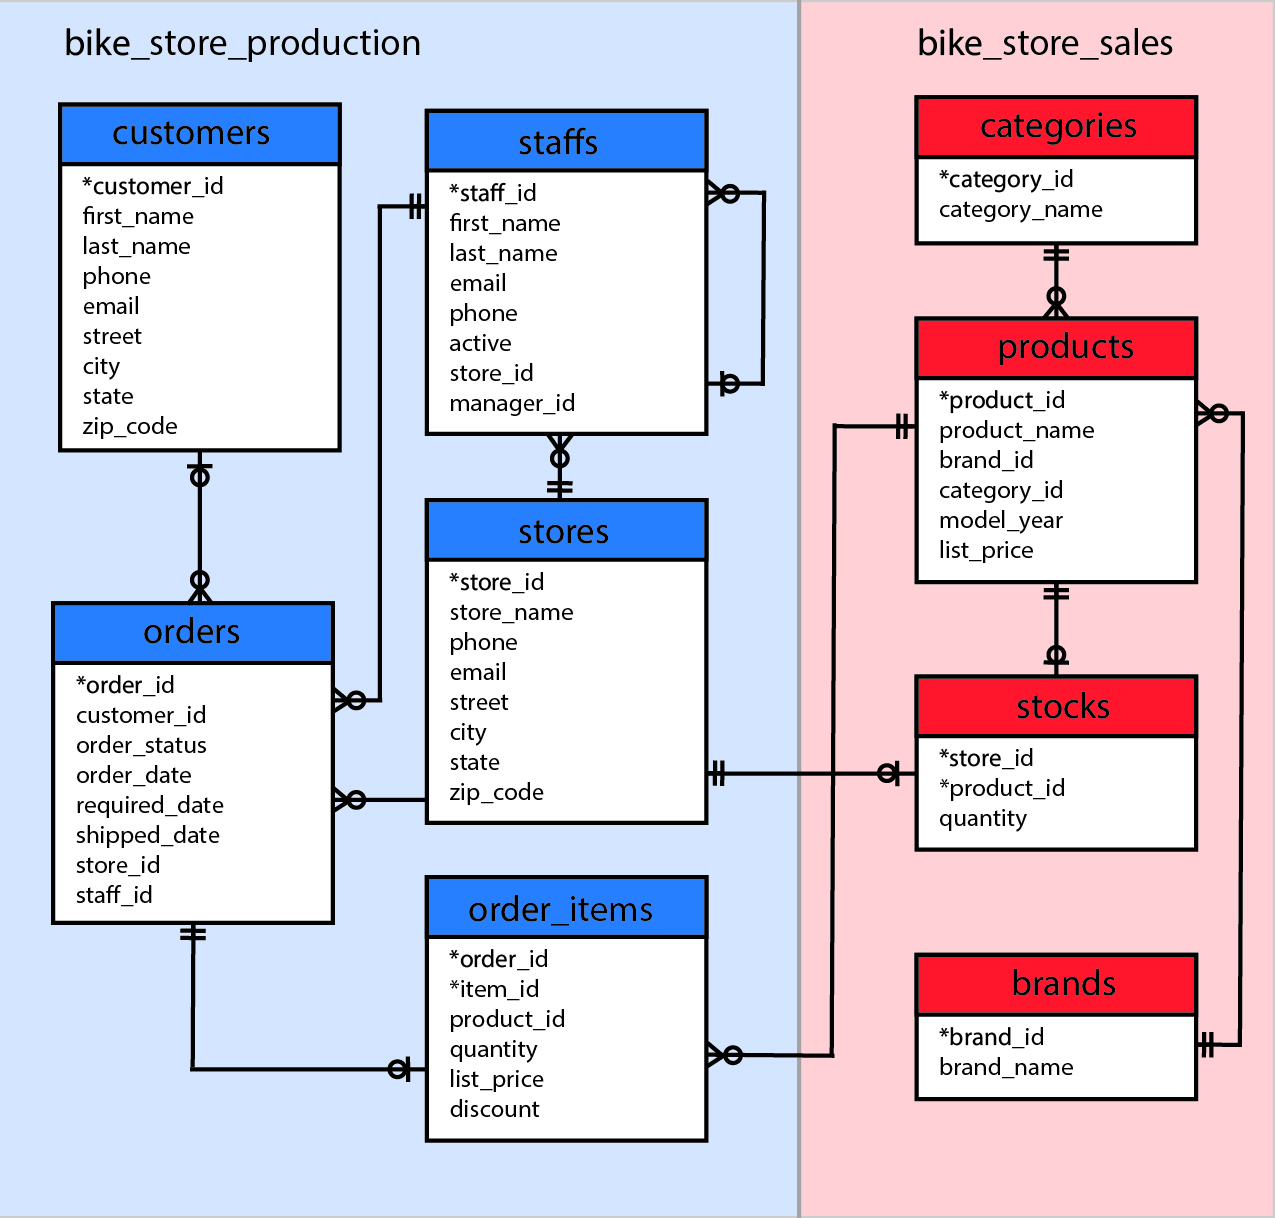
Let's start with a basic query trying to retrieve order data from a specific store:
SELECT *
FROM bike_store_sales.stores s
JOIN bike_store_sales.orders o
ON o.store_id = s.store_id
WHERE store_name = 'Santa Cruz Bikes';
Using EXPLAIN, we can get information of the query execution:
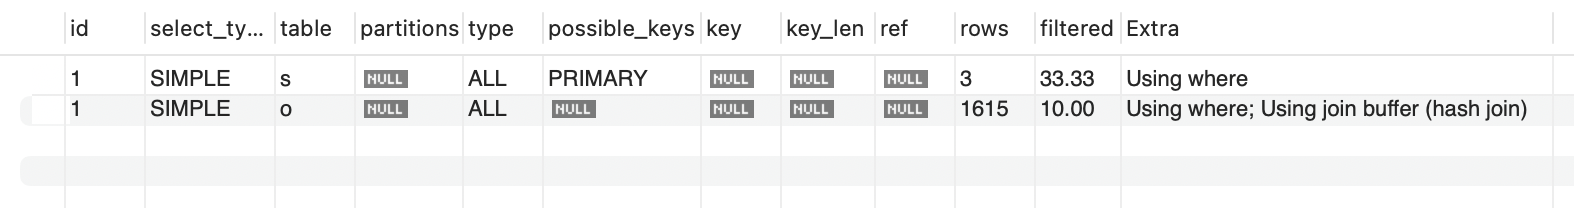
Whenever calling WHERE in a query, it is important to check where indexes can be useful. This query is looking for store_name = 'Santa Cruz Bikes' and joins the two tables on the store_id column.
Knowing this, it would be useful to have indexes for store_name and store_id:
CREATE INDEX store_name ON bike_store_sales.stores (store_name);
CREATE INDEX store_id ON bike_store_sales.orders (store_id);
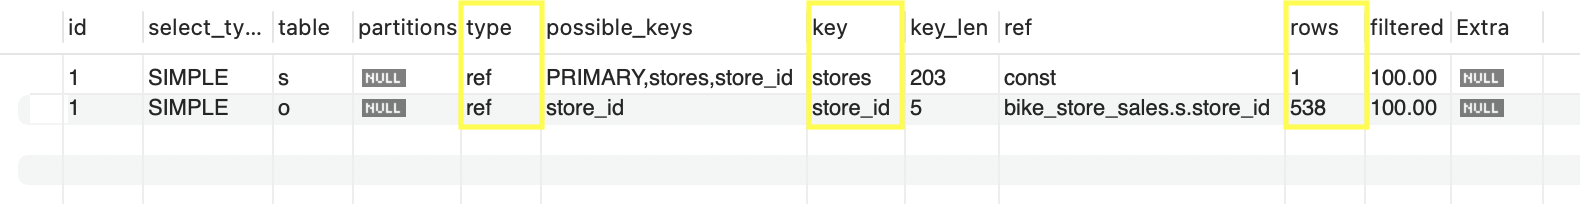
Rerunning EXPLAIN on the query, there are a few changes to note. Firstly, We can see the newly indexed rows in the query under the key column. The join type (under the type column) has also changed from "ALL" to "ref". This means the join went from fully scanning the whole table to only searching rows with matching index values - a much more efficient approach.
Under the rows column we can see the number of rows being queried has been reduced significantly compared the non-indexed query:
Now that the tables are indexed, it is important to optimize the JOIN and SELECT portions of the query.
We want to return rows that have matching values in both tables. This is already done with JOIN, but could be clearer syntactically using INNER JOIN (which does the same thing).
The query currently returns all columns in both the stores and orders table - this returns unneeded information including many id columns. To clean up the query selection, we will also use SELECT only on the columns we need:
SELECT store_name, phone, email, street, city, order_status, order_date, shipped_date
FROM bike_store_sales.stores s
INNER JOIN bike_store_sales.orders o
ON o.store_id = s.store_id
WHERE store_name = 'Santa Cruz Bikes';
Conclusion
MySQL is a powerful database management tool with high performance, scalability, data security, and an abundance of documentation and support. Learning MySQL can be a challenge, but being able to optimize performance is essential in getting the most out of the program. Hands-on experience, tutorials, and familiarizing yourself with the documentation is the best way to learn MySQL and fast-track yourself towards fluency.